We are often asked what a ‘normal’ Direct Debit failure rate would be. As always, the answer is …‘it depends’. Various factors influence the percentage of Direct Debit collections that are returned unpaid. These include:
- Time of year
- Collection date
- Amount being collected
- Industry / sector
- Type of goods or service being collected for.
Calculating your Direct Debit Unpaid rate
The first step is to understand how many of your Direct Debits are returned unpaid. The good news is that to help you do this you can use your Bacs reports. The Advice of Returned Unpaid Direct Debit Report (ARUDD Report) is produced by Bacs on day 4 of the Bacs cycle. This is the day after your Direct Debit Collections. It is also possible for a second, smaller ARUDD report to be produced on Day 5 of the Bacs cycle. These ARUDD reports will advise you of which Direct Debits have failed. They will also provide you with a reason for the failure. A full list of Reason codes are listed on our website. From these you can calculate your failure rate (transactions returned unpaid, divided by the total number of transactions, expressed as a %).
If you offer different collection dates during the month it is worth considering if the failure rates are consistent or if they vary according to the collection date. For example Direct Debits collected on the 1st of the month may be more successful than those collected at the end of the month. This is because many consumers will have just received their salary payments and will have funds available.
Identifying Reasons for Failure that are within your Control
Some reasons for Direct Debit failures are outside of the organisations control. An obvious example of this is Reason Code 2 – “Payer deceased”. This typically can’t be planned for by the collecting organisation. Other reasons for failures however are within the organisations control. Examples of these would be Reason Code 4 – “Advance Notice Disputed” or Reason Code 7 – “Amount differs”. If the organisation is operating an efficient and compliant Direct Debit scheme then failures should not occur for such reasons. Payers should have received Advance Notice and be prepared for the Direct Debit Collection.
Unpaid Direct Debits due to Reason Code 0 – “Refer to Payer”
The Office for National Statistics recently published data provided by Pay.UK regarding Direct Debits returned for Reason Code “0” – Refer to Payer. This data shows Direct Debits returned unpaid as a % of all Direct Debit collections. (Note: Reason code 0 “Refer to Payer” is the most common failure code for Direct Debits across the board).
The ONS describes this failure rate as “the number of direct debit failures due to insufficient funds”. In fact this is not entirely accurate. Reason code 0 – “Refer to Payer“ simply means that the individual Direct Debit has been returned on this occasion. The Service User collecting the amount should ‘Ask the Payer why’. It is typically understood to mean ‘Insufficient funds in the account’ (and may well mean this on the majority of occasions) however there are other reasons why this code may be used. We have alerted Pay.UK to this mislabelling.
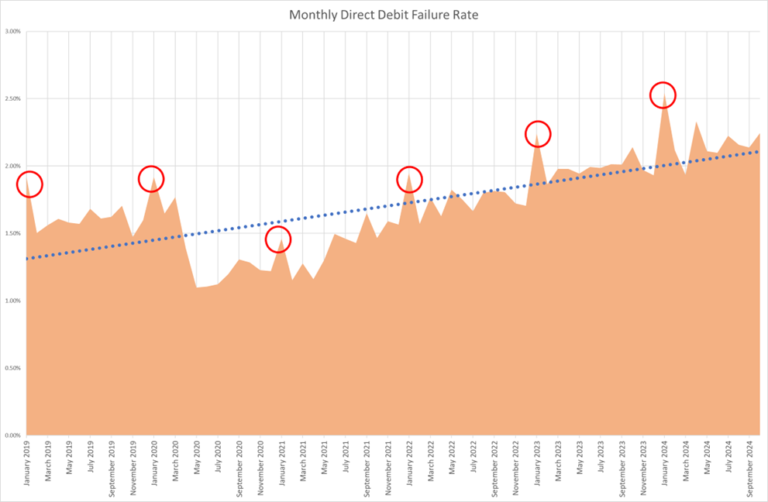
When looking at this data, we can see some interesting trends. We have drawn up the graph below to illustrate Direct Debit failure rates (as a %), from January 2019 up until October 2024.
Overall Trend: Monthly Direct Debit failure rates are increasing.
As the blue trendline below shows, the overall monthly Direct Debit failure rate is increasing. This is perhaps not unexpected given the increase in cost of living. In October 2024 for example the monthly Direct Debit Failure rate was 2.25%. This had grown from the figure 12 months earlier, in October 2023, where it was 2.14%. In turn, the figure in October 2023 was higher than the figure in October 2022, where it was 1.81%.
Typical failure rates are influenced by the time of year.
As the red circles show, the monthly Direct Debit failure rates are higher each January than in subsequent months. Again, this is perhaps understandable given the additional financial demands often placed on consumers and businesses over the festive period.

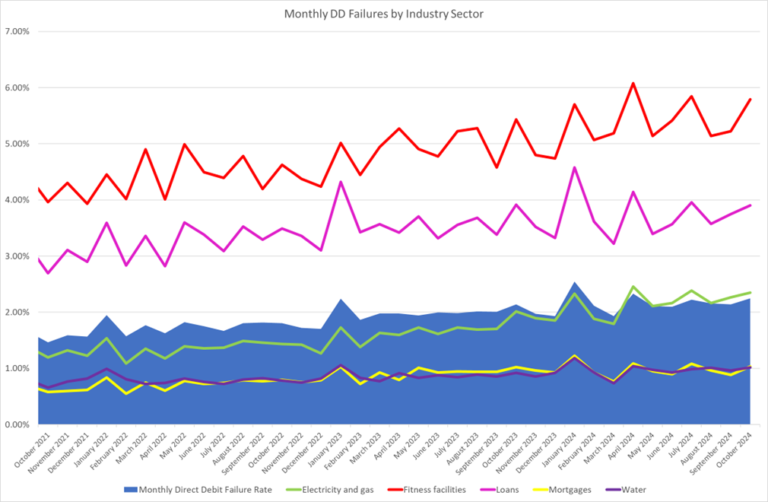
Monthly Direct Debit Failure Rates are impacted by the Industry Sector.
In the chart below, the blue shaded area represents the average monthly Direct Debit failure rates across the last 3 years. The different lines indicate the failure rates in different industries. Here we see that failure rates are higher within the Fitness Industry (Red line) and when the Direct Debits are collected to repay loans (Pink line). The failure rates for Electricity and Gas (Green line), Mortgages (Yellow line) and Water (Purple line) are lower than the average. This could reflect the fact that consumers are keen not to default on Direct Debit payments in ‘essential’ areas – perhaps due to a fear / the risk of consequences (e.g. loss of service provision or mortgage default).
Monthly Direct Debit Failure Rates are Increasing across different Industry Sectors.
If we look across different industry sectors we see the same trend of increase in monthly Direct Debit failure rates.
– Within Fitness, the monthly failure rate was 5.79% in Oct 24 – an increase from the rate of 5.43% in Oct 23.
– Within Electricity & Gas, the monthly failure rate was 2.35% in Oct 24 vs 2.01% In Oct 23.

Top Tips to help Improve Direct Debit Failure Rates
Understanding what failure rate is typical for your industry and what reason codes your Direct Debits are failing for is key. This should give an insight into whether you are operating an efficient scheme and whether there are improvements that you could make to help reduce the rate of unpaid items. Here are 5 tips:
- Review your ARUDD report to understand which Direct Debits are being returned unpaid and the reasons why.
- Identify the return reasons that are within your control (for example, 4 – Advance Notice Disputed or 7 – Amount differs). Review, and where necessary, improve internal processes to attempt to eliminate such returns.
- Identify the return reasons that are ‘outside’ of your control such as “0 – Refer to Payer” or “1 – Instruction cancelled” and consider if there are ways you could reduce the likelihood of these occurring – e.g. offering different collection dates or frequencies (to split annual collections into quarterly or monthly payments that might be more achievable for payers).
- Consider re-presenting failed Direct Debits if this is not currently being undertaken
- Ensure you are actioning all your Bacs reports including AUDDIS reports and ADDACS reports to keep your database as ‘clean’ as possible. This will give you the highest chance of successful collections possible.
Questions?
If you have questions about reducing your Direct Debit failure rates, please contact us. We are happy to help!